Use OpenTracing with Zipkin and the Micronaut Framework for Microservice Distributed Tracing
Use Zipkin distributed tracing to investigate the behaviour of your Micronaut applications.
Authors: Sergio del Amo
Micronaut Version: 4.10.9
1. Getting Started
In this guide, we will integrate Zipkin in a Micronaut application composed of three microservices.
Zipkin is a distributed tracing system. It helps gather timing data needed to troubleshoot latency problems in microservice architectures. It manages both the collection and lookup of this data.
You will discover how the Micronaut framework eases Zipkin integration.
2. What you will need
To complete this guide, you will need the following:
-
Some time on your hands
-
A decent text editor or IDE (e.g. IntelliJ IDEA)
-
JDK 21 or greater installed with
JAVA_HOMEconfigured appropriately
3. Solution
We recommend that you follow the instructions in the next sections and create the application step by step. However, you can go right to the completed example.
-
Download and unzip the source
4. Writing the Application
To learn more about this sample application, read the Consul and the Micronaut Framework - Microservices Service Discovery guide. The application contains three microservices.
-
bookcatalogue- This returns a list of books. It uses a domain consisting of a book name and an ISBN. -
bookinventory- This exposes an endpoint to check whether a book has sufficient stock to fulfil an order. It uses a domain consisting of a stock level and an ISBN. -
bookrecommendation- This consumes previous services and exposes an endpoint that recommends book names that are in stock.
The bookcatalogue service consumes endpoints exposed by the other services. The following image illustrates the application flow:
A request to bookrecommendation (http://localhost:8080/books) triggers several requests through our microservices mesh.
5. Zipkin and the Micronaut Framework
5.1. Install Zipkin via Docker
The quickest way to start Zipkin is via Docker:
docker run -d -p 9411:9411 openzipkin/zipkin5.2. Book catalogue
Add tracing dependency.
<dependency>
    <groupId>io.micronaut</groupId>
    <artifactId>micronaut-tracing</artifactId>
    <scope>compile</scope>
</dependency>
Also, to send tracing spans to Zipkin, the minimal configuration requires you to add the following dependencies:
<dependency>
    <groupId>io.opentracing.brave</groupId>
    <artifactId>micronaut-tracing</artifactId>
    <scope>compile</scope>
</dependency>
<dependency>
    <groupId>io.zipkin.brave</groupId>
    <artifactId>brave-instrumentation-http</artifactId>
    <scope>runtime</scope>
</dependency>
<dependency>
    <groupId>io.zipkin.reporter</groupId>
    <artifactId>zipkin-reporter</artifactId>
    <scope>runtime</scope>
</dependency>
Append to bookcatalogue service application.properties the following snippet:
tracing.zipkin.http.url=http://localhost:9411
tracing.zipkin.enabled=true
(1)
tracing.zipkin.sampler.probability=1| 1 | Trace 100% of requests. |
In production, you will probably want to trace a smaller percentage of the requests. However, in order to keep this guide simple, we set it to trace 100%.
Disable distributed tracing in tests:
tracing.zipkin.enabled=false5.3. Book inventory
Add tracing dependency.
<dependency>
    <groupId>io.micronaut</groupId>
    <artifactId>micronaut-tracing</artifactId>
    <scope>compile</scope>
</dependency>
Also, to send tracing spans to Zipkin, the minimal configuration requires you to add the following dependencies:
<dependency>
    <groupId>io.opentracing.brave</groupId>
    <artifactId>micronaut-tracing</artifactId>
    <scope>compile</scope>
</dependency>
<dependency>
    <groupId>io.zipkin.brave</groupId>
    <artifactId>brave-instrumentation-http</artifactId>
    <scope>runtime</scope>
</dependency>
<dependency>
    <groupId>io.zipkin.reporter</groupId>
    <artifactId>zipkin-reporter</artifactId>
    <scope>runtime</scope>
</dependency>
Append to bookinventory service application.properties the following snippet:
tracing.zipkin.http.url=http://localhost:9411
tracing.zipkin.enabled=true
(1)
tracing.zipkin.sampler.probability=1| 1 | Trace 100% of requests. |
In production, you will probably want to trace a smaller percentage of the requests. However, in order to keep this guide simple, we set it to trace 100%.
Disable distributed tracing in tests:
tracing.zipkin.enabled=falseAnnotate BookController method with @ContinueSpan and the method parameter with @SpanTag:
package example.micronaut;

import io.micronaut.http.MediaType;
import io.micronaut.http.annotation.Controller;
import io.micronaut.http.annotation.Get;
import io.micronaut.http.annotation.Produces;
import io.micronaut.tracing.annotation.ContinueSpan;
import io.micronaut.tracing.annotation.SpanTag;

import jakarta.validation.constraints.NotBlank;
import java.util.Optional;

@Controller("/books")
public class BooksController {

    @Produces(MediaType.TEXT_PLAIN)
    @Get("/stock/{isbn}")
    @ContinueSpan (1)
    public Boolean stock(@SpanTag("stock.isbn") @NotBlank String isbn) { (2)
        return bookInventoryByIsbn(isbn).map(bi -> bi.getStock() > 0).orElse(null);
    }

    private Optional<BookInventory> bookInventoryByIsbn(String isbn) {
        if (isbn.equals("1491950358")) {
            return Optional.of(new BookInventory(isbn, 4));

        } else if (isbn.equals("1680502395")) {
            return Optional.of(new BookInventory(isbn, 0));
        }
        return Optional.empty();
    }
}| 1 | The @ContinueSpan annotation will continue an existing span, wrapping the method call or reactive type. |
| 2 | The @SpanTag annotation can be used on method arguments to include the value of each argument within a Span’s tags. When you use @SpanTag you need either to annotate the method with @NewSpan or @ContinueSpan. |
5.4. Book recommendation
Add tracing dependency.
<dependency>
    <groupId>io.micronaut</groupId>
    <artifactId>micronaut-tracing</artifactId>
    <scope>compile</scope>
</dependency>
Also, to send tracing spans to Zipkin, the minimal configuration requires you to add the following dependencies:
<dependency>
    <groupId>io.opentracing.brave</groupId>
    <artifactId>micronaut-tracing</artifactId>
    <scope>compile</scope>
</dependency>
<dependency>
    <groupId>io.zipkin.brave</groupId>
    <artifactId>brave-instrumentation-http</artifactId>
    <scope>runtime</scope>
</dependency>
<dependency>
    <groupId>io.zipkin.reporter</groupId>
    <artifactId>zipkin-reporter</artifactId>
    <scope>runtime</scope>
</dependency>
Append to bookrecommendation service application.properties the following snippet:
tracing.zipkin.http.url=http://localhost:9411
tracing.zipkin.enabled=true
(1)
tracing.zipkin.sampler.probability=1| 1 | Trace 100% of requests. |
In production, you will probably want to trace a smaller percentage of the requests. However, in order to keep this guide simple, we set it to trace 100%.
Disable distributed tracing in tests:
tracing.zipkin.enabled=false6. Running the Application
Run bookcatalogue microservice:
To run the application, execute ./mvnw mn:run.
...
14:28:34.034 [main] INFO  io.micronaut.runtime.Micronaut - Startup completed in 499ms. Server Running: http://localhost:8081
Run bookinventory microservice:
To run the application, execute ./mvnw mn:run.
...
14:31:13.104 [main] INFO  io.micronaut.runtime.Micronaut - Startup completed in 506ms. Server Running: http://localhost:8082
Run bookrecommendation microservice:
To run the application, execute ./mvnw mn:run.
...
14:31:57.389 [main] INFO  io.micronaut.runtime.Micronaut - Startup completed in 523ms. Server Running: http://localhost:8080
You can run a cURL command to test the whole application:
curl http://localhost:8080/books[{"name":"Building Microservices"}]You can then navigate to http://localhost:9411 to access the Zipkin UI.
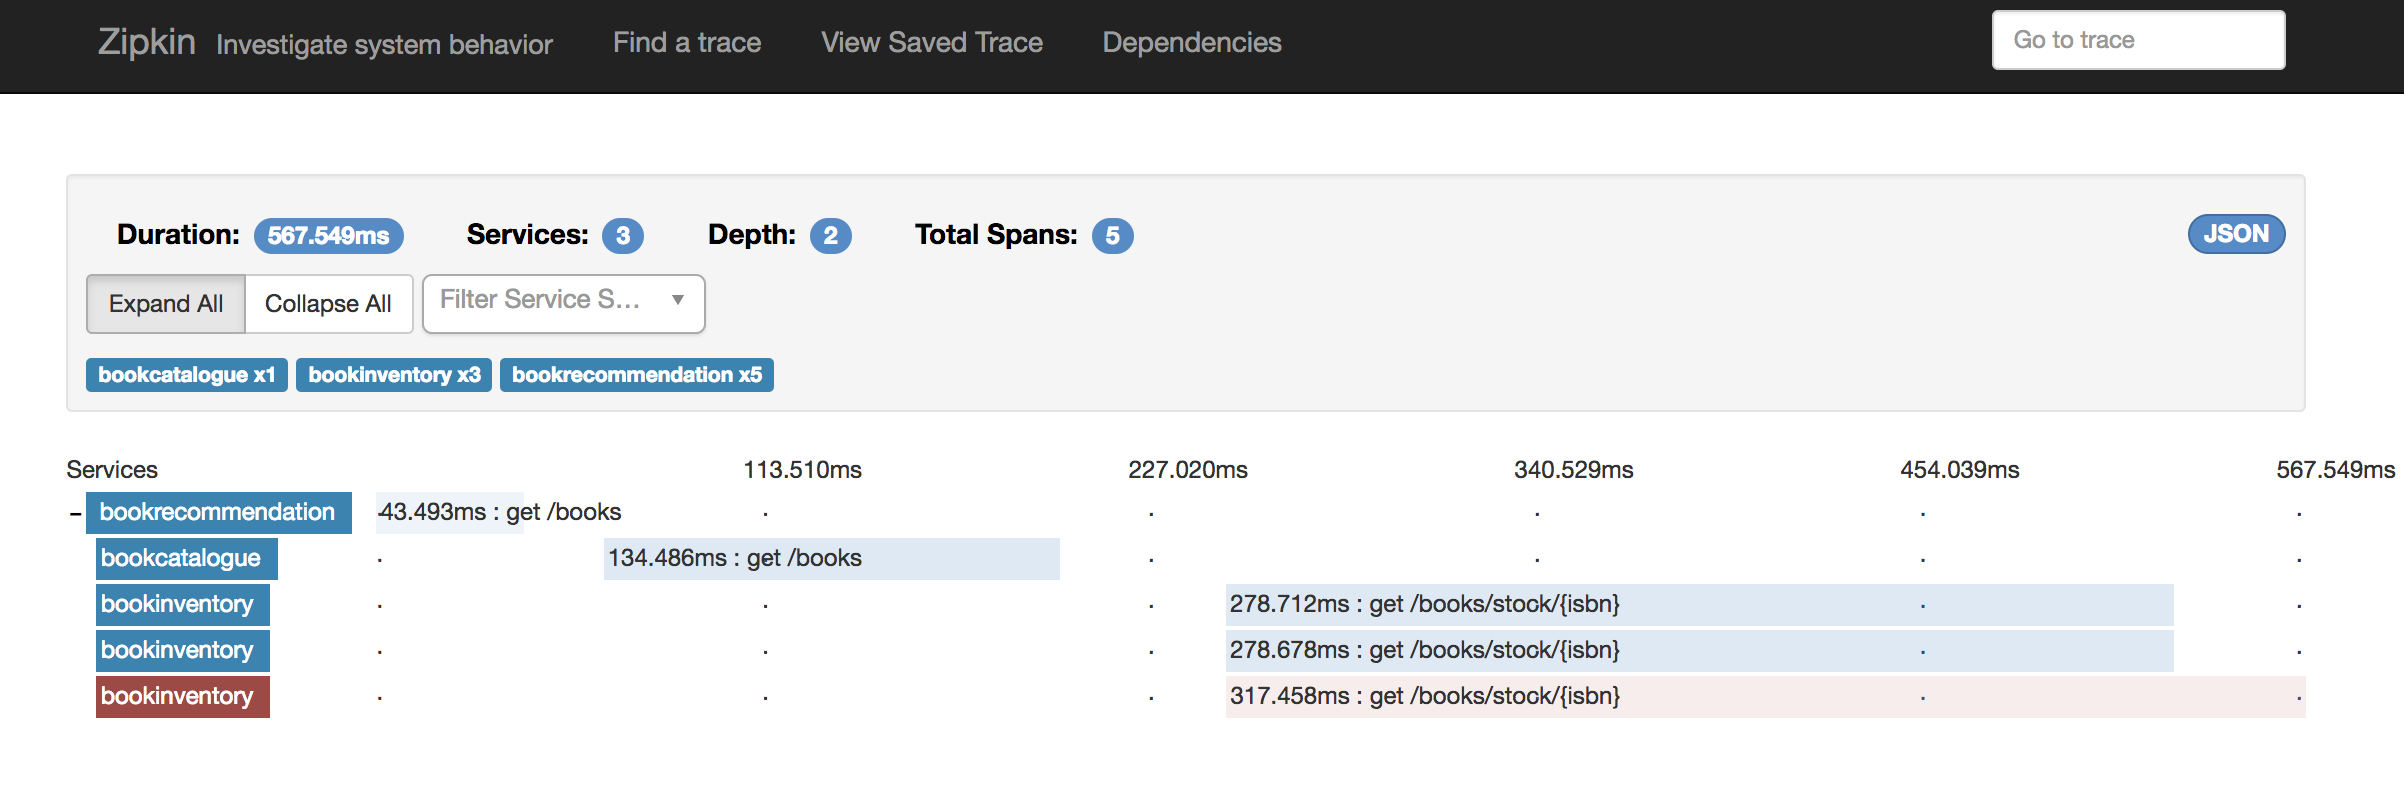
The previous request generates a trace composed by 5 spans.

In the previous image, you can see the requests to bookinventory are done in parallel.
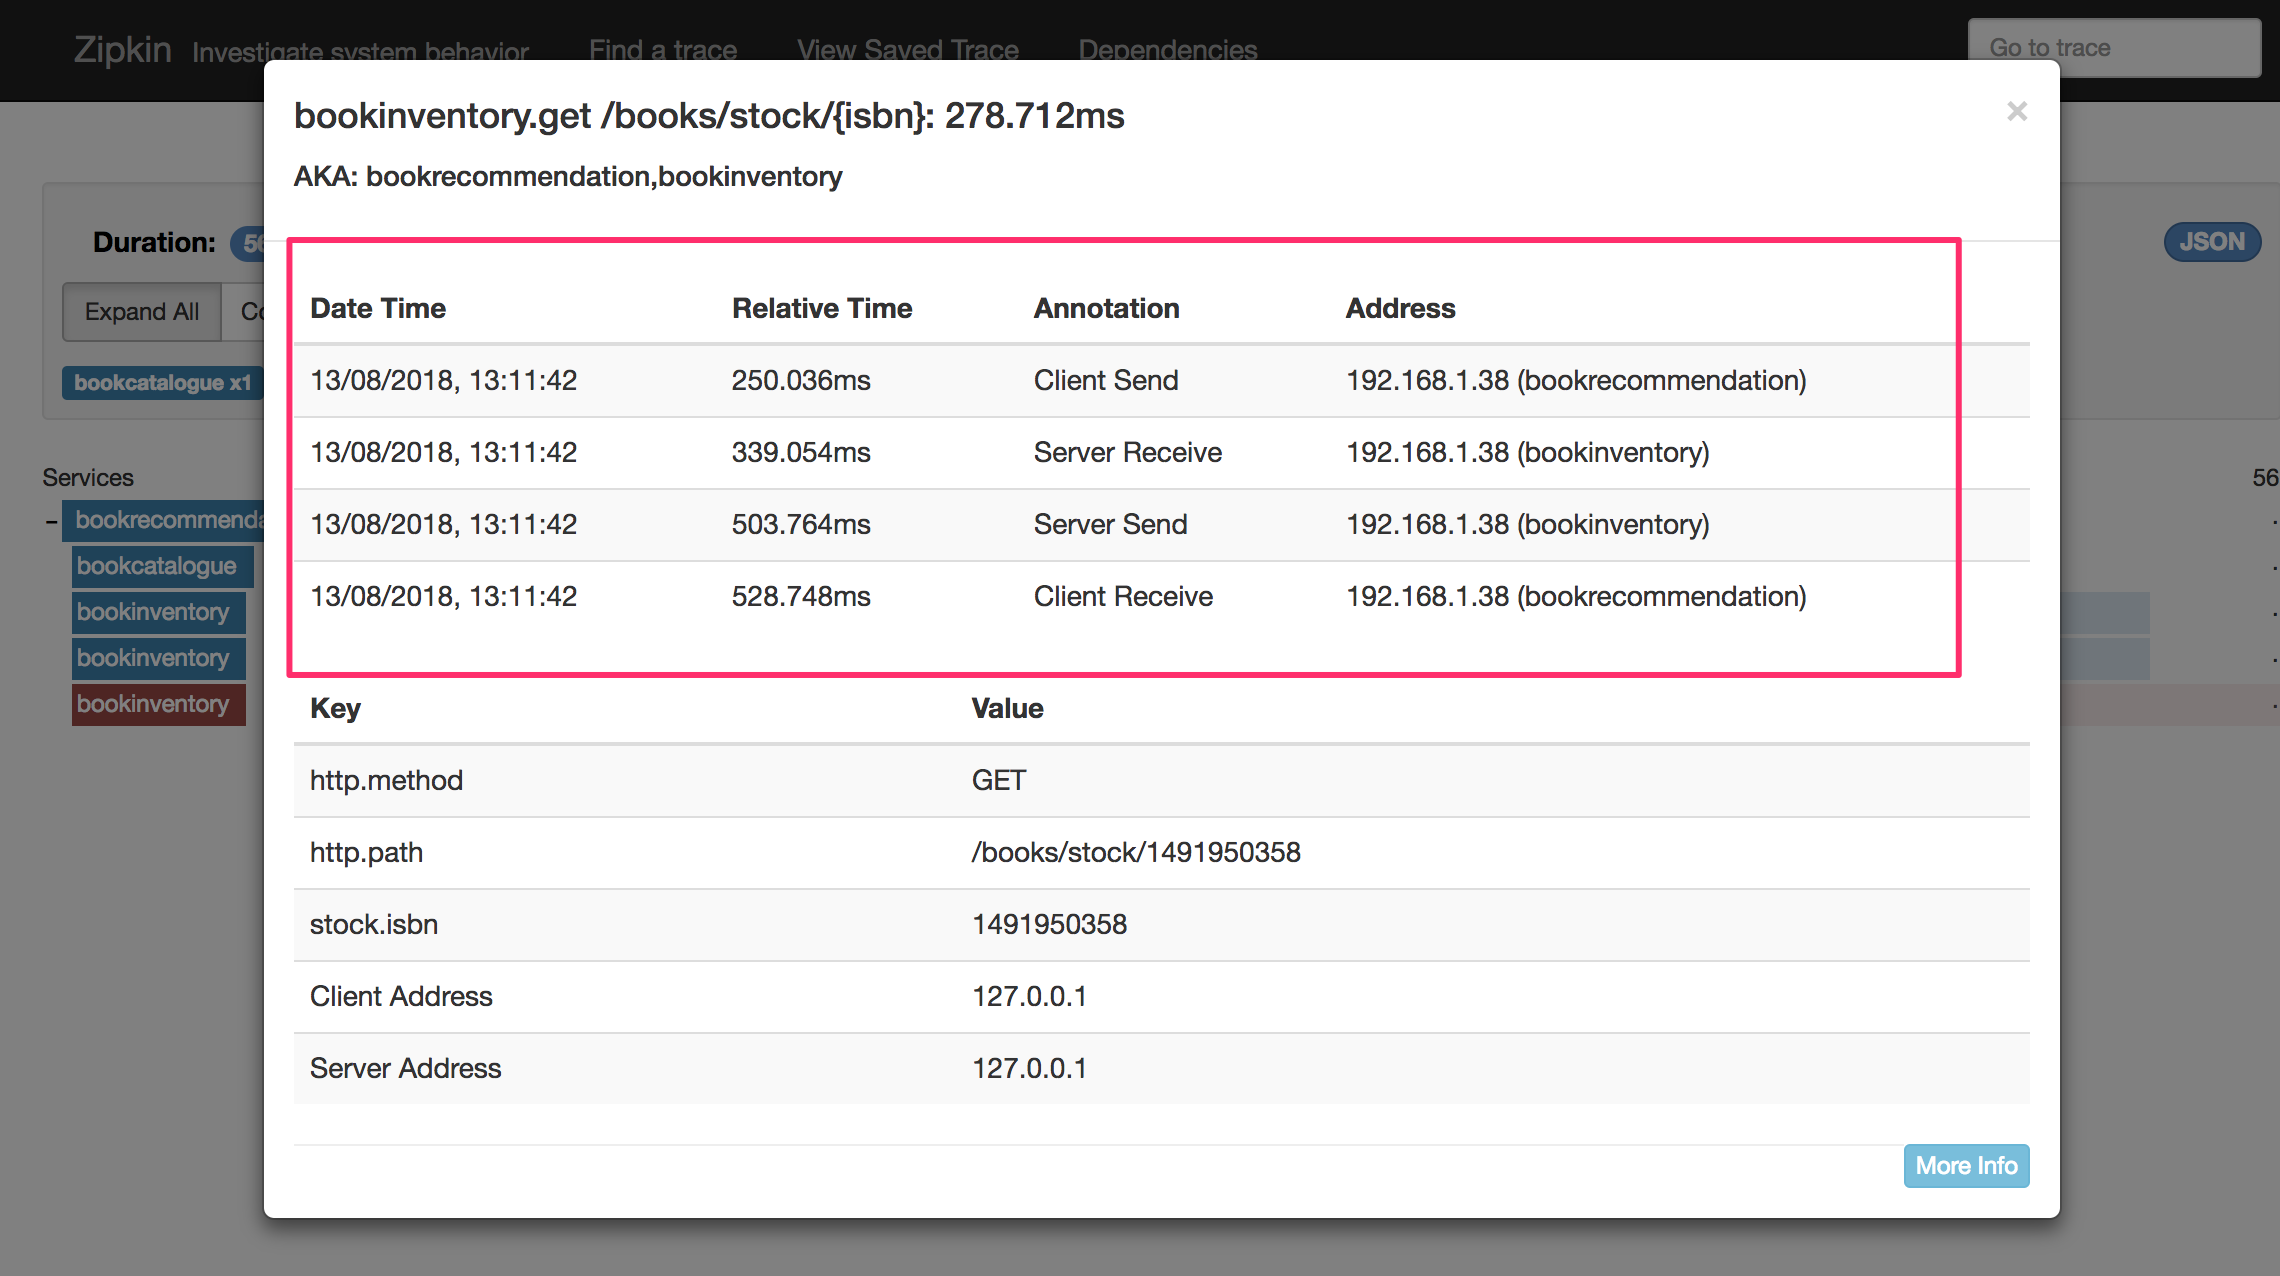
You can see the details if you click the span:

In the previous image, you can see that:
-
Whenever a Micronaut HTTP client executes a new network request, a span is involved.
-
Whenever a Micronaut server receives a request, a span is involved.
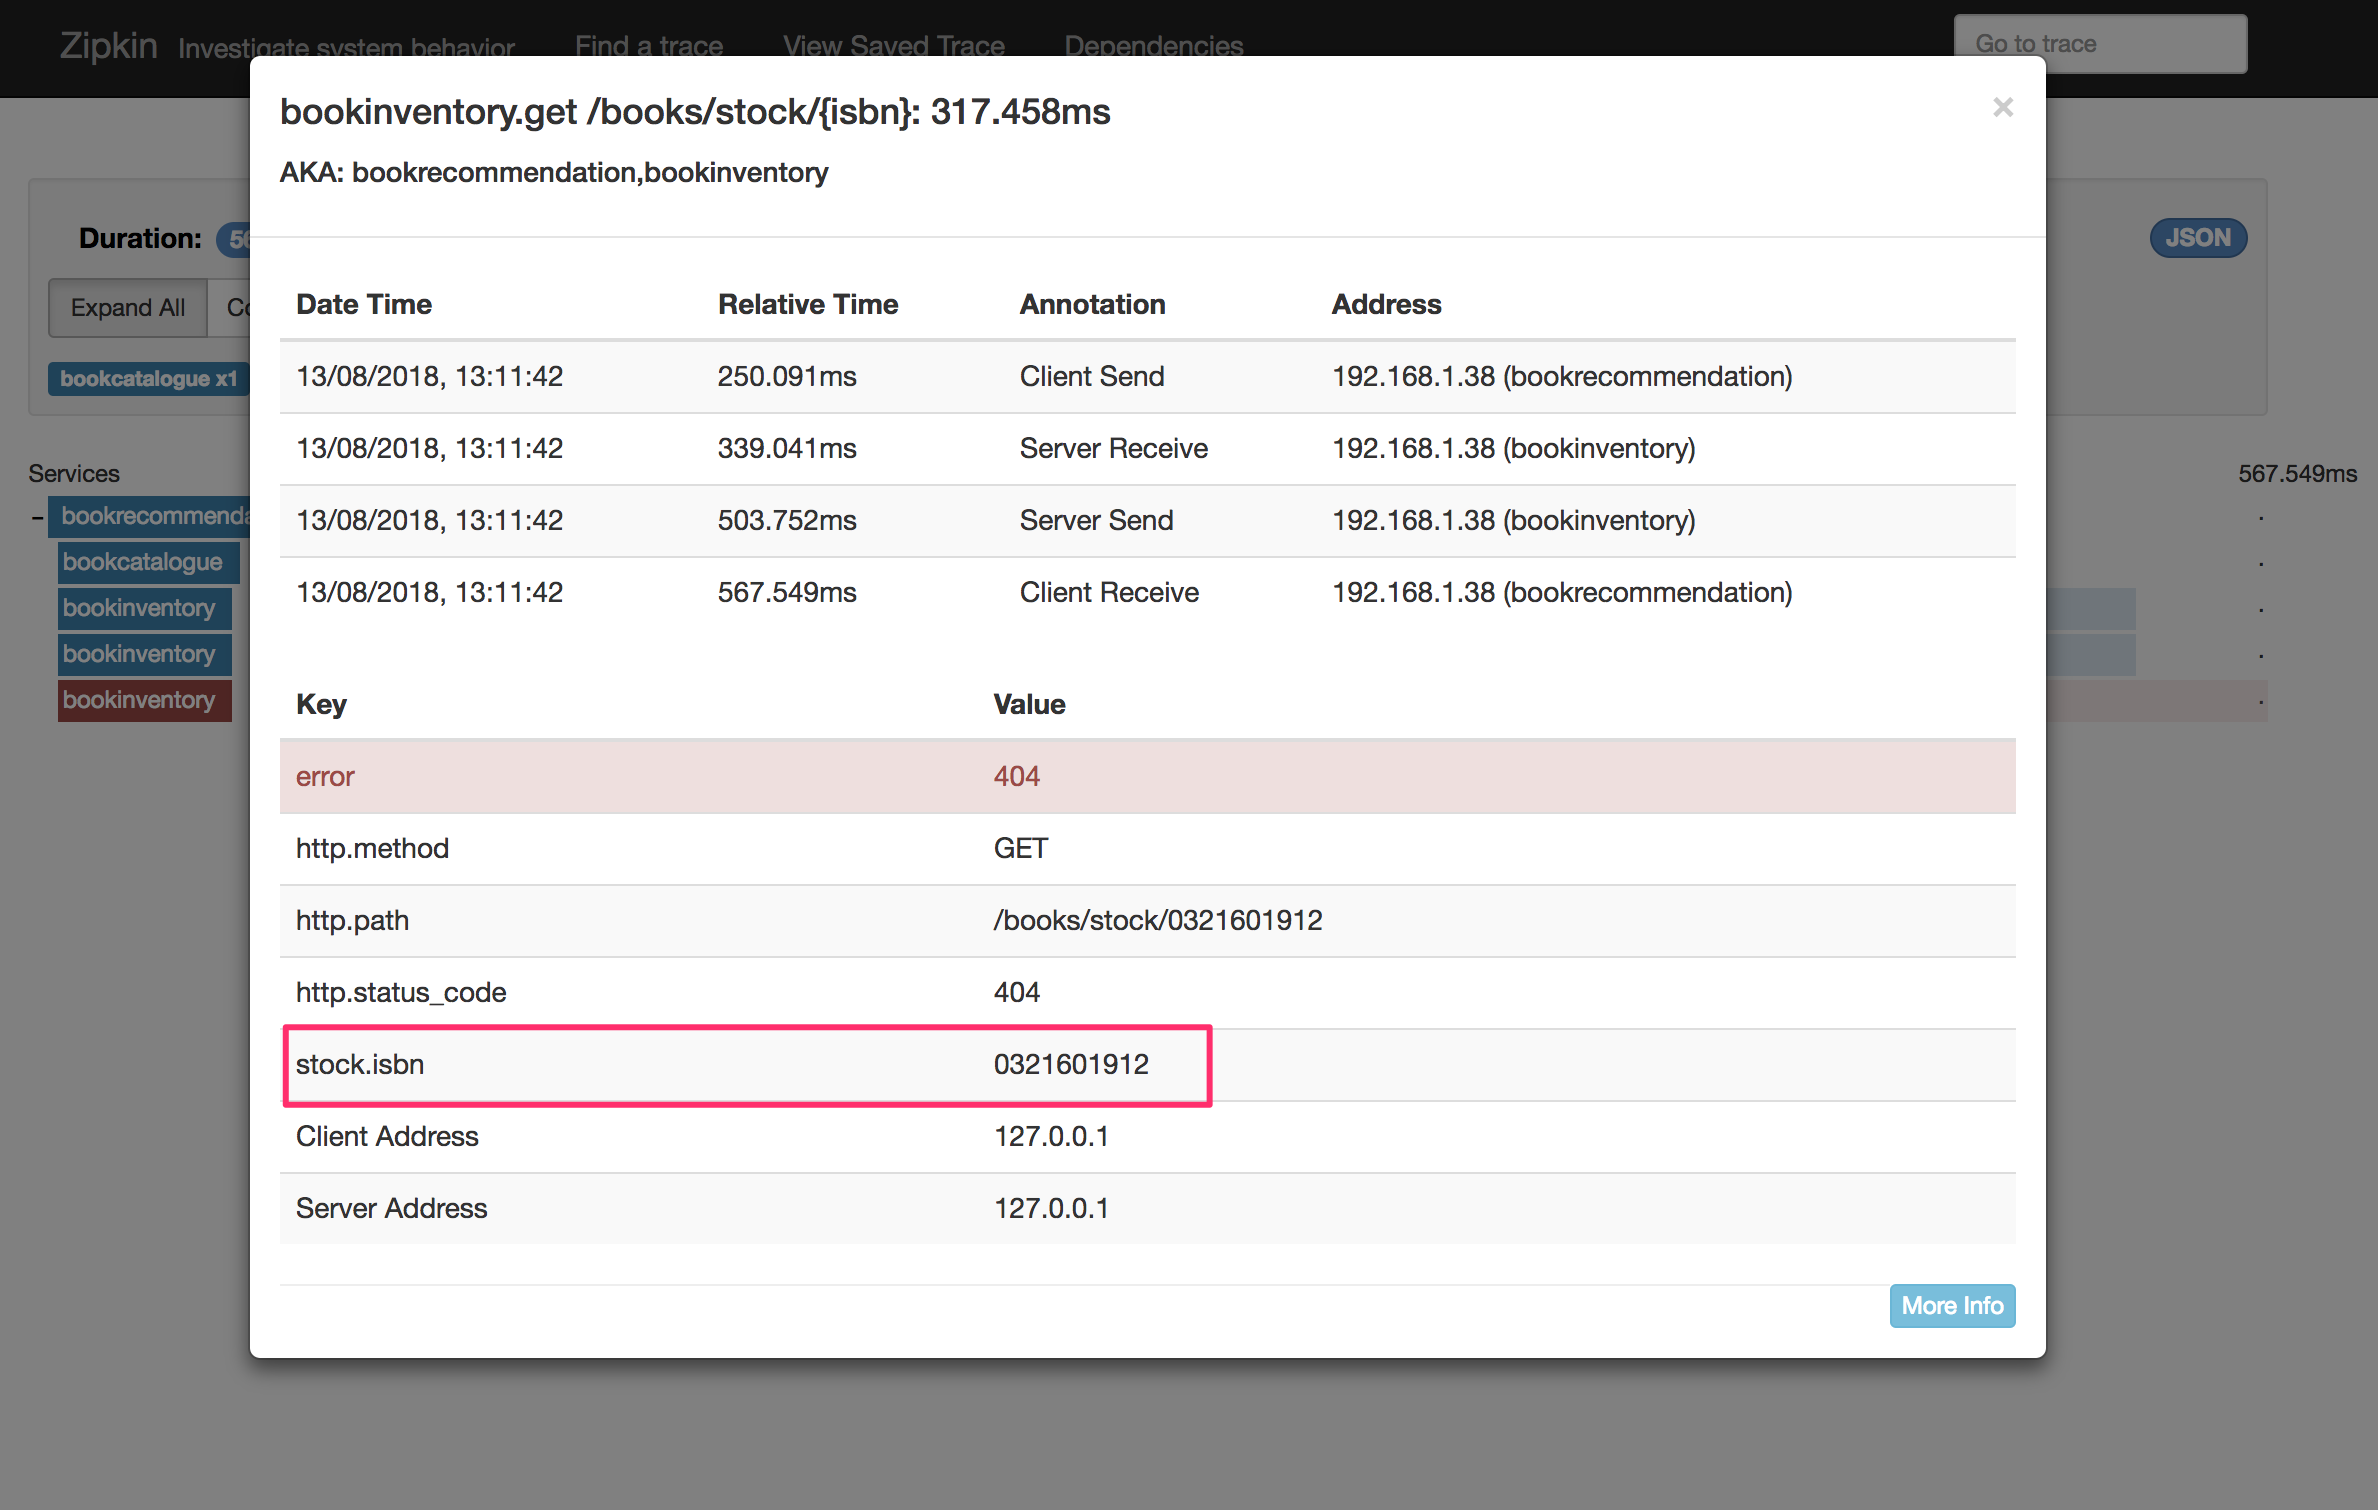
The stock.isbn tags that we configured with @SpanTag is present as shown in the next image:

7. Generate a Micronaut Application Native Executable with GraalVM
We will use GraalVM, an advanced JDK with ahead-of-time Native Image compilation, to generate a native executable of this Micronaut application.
Compiling Micronaut applications ahead of time with GraalVM significantly improves startup time and reduces the memory footprint of JVM-based applications.
Only Java and Kotlin projects support using GraalVM’s native-image tool. Groovy relies heavily on reflection, which is only partially supported by GraalVM.
|
7.1. GraalVM Installation
sdk install java 21.0.5-graalFor installation on Windows, or for a manual installation on Linux or Mac, see the GraalVM Getting Started documentation.
The previous command installs Oracle GraalVM, which is free to use in production and free to redistribute, at no cost, under the GraalVM Free Terms and Conditions.
Alternatively, you can use the GraalVM Community Edition:
sdk install java 21.0.2-graalce7.2. Native Executable Generation
To generate a native executable using Maven, run:
./mvnw package -Dpackaging=native-imageThe native executable is created in the target directory and can be run with target/micronautguide.
It is possible to customize the name of the native executable or pass additional build arguments using the Maven plugin for GraalVM Native Image building. Declare the plugin as following:
<plugin>
    <groupId>org.graalvm.buildtools</groupId>
    <artifactId>native-maven-plugin</artifactId>
    <version>0.11.3</version>
    <configuration>
         (1)
         <imageName>mn-graalvm-application</imageName>
        <buildArgs>
          (2)
          <buildArg>-Ob</buildArg>
        </buildArgs>
    </configuration>
</plugin>| 1 | The native executable name will now be mn-graalvm-application. |
| 2 | It is possible to pass extra build arguments to native-image. For example, -Ob enables the quick build mode. |
Start the native executables for the three microservices and run the same curl request as before to check that everything works with GraalVM.
8. Next Steps
As you have seen in this guide, without any annotations, you get distributed tracing up and running fast with the Micronaut framework.
The Micronaut framework includes several annotations to give you more flexibility. We introduced the @ContinueSpan and @SpanTag annotations.
Also, you have at your disposal the @NewSpan annotation, which will create a new span, wrapping the method call or reactive type.
Make sure to read more about Tracing with Zipkin in the Micronaut framework.
9. Help with the Micronaut Framework
The Micronaut Foundation sponsored the creation of this Guide. A variety of consulting and support services are available.
10. License
| All guides are released with an Apache license 2.0 license for the code and a Creative Commons Attribution 4.0 license for the writing and media (images…). |