

Collect metrics with the Micronaut Framework and monitor them on Oracle Cloud
Learn how to collect standard and custom metrics with the Micronaut framework and monitor them on Oracle Cloud.
On this guide
In this section
Getting Started
In this guide, we will create a Micronaut application written in Groovy.
We’ll use Micronaut Micrometer to expose application metric data with Micrometer.
What you will need
To complete this guide, you will need the following:
-
Some time on your hands
-
A decent text editor or IDE (e.g. IntelliJ IDEA)
-
JDK 21 or greater installed with
JAVA_HOMEconfigured appropriately -
An Oracle Cloud account (create a free trial account at signup.oraclecloud.com)
-
We’ll use the OCI command line to authenticate. If you don’t have it already, install the Oracle Cloud CLI and run
oci setup config.
The Application
Monitor metrics on Oracle Cloud
To publish metrics to Oracle Cloud, you have to adjust your application configuration slightly, and then you will be able to create queries and monitor your metrics on the Oracle Cloud Metrics Explorer.
|
Note
|
By default, metrics will be published in your root compartment (tenancy). If you want to specify in which compartment metrics should be published, you can add |
Visit the Oracle Cloud Metrics Explorer.
In the query editor, create the query that you want to monitor. You have to specify the compartment (#1), namespace (#2), and metric name (#3).
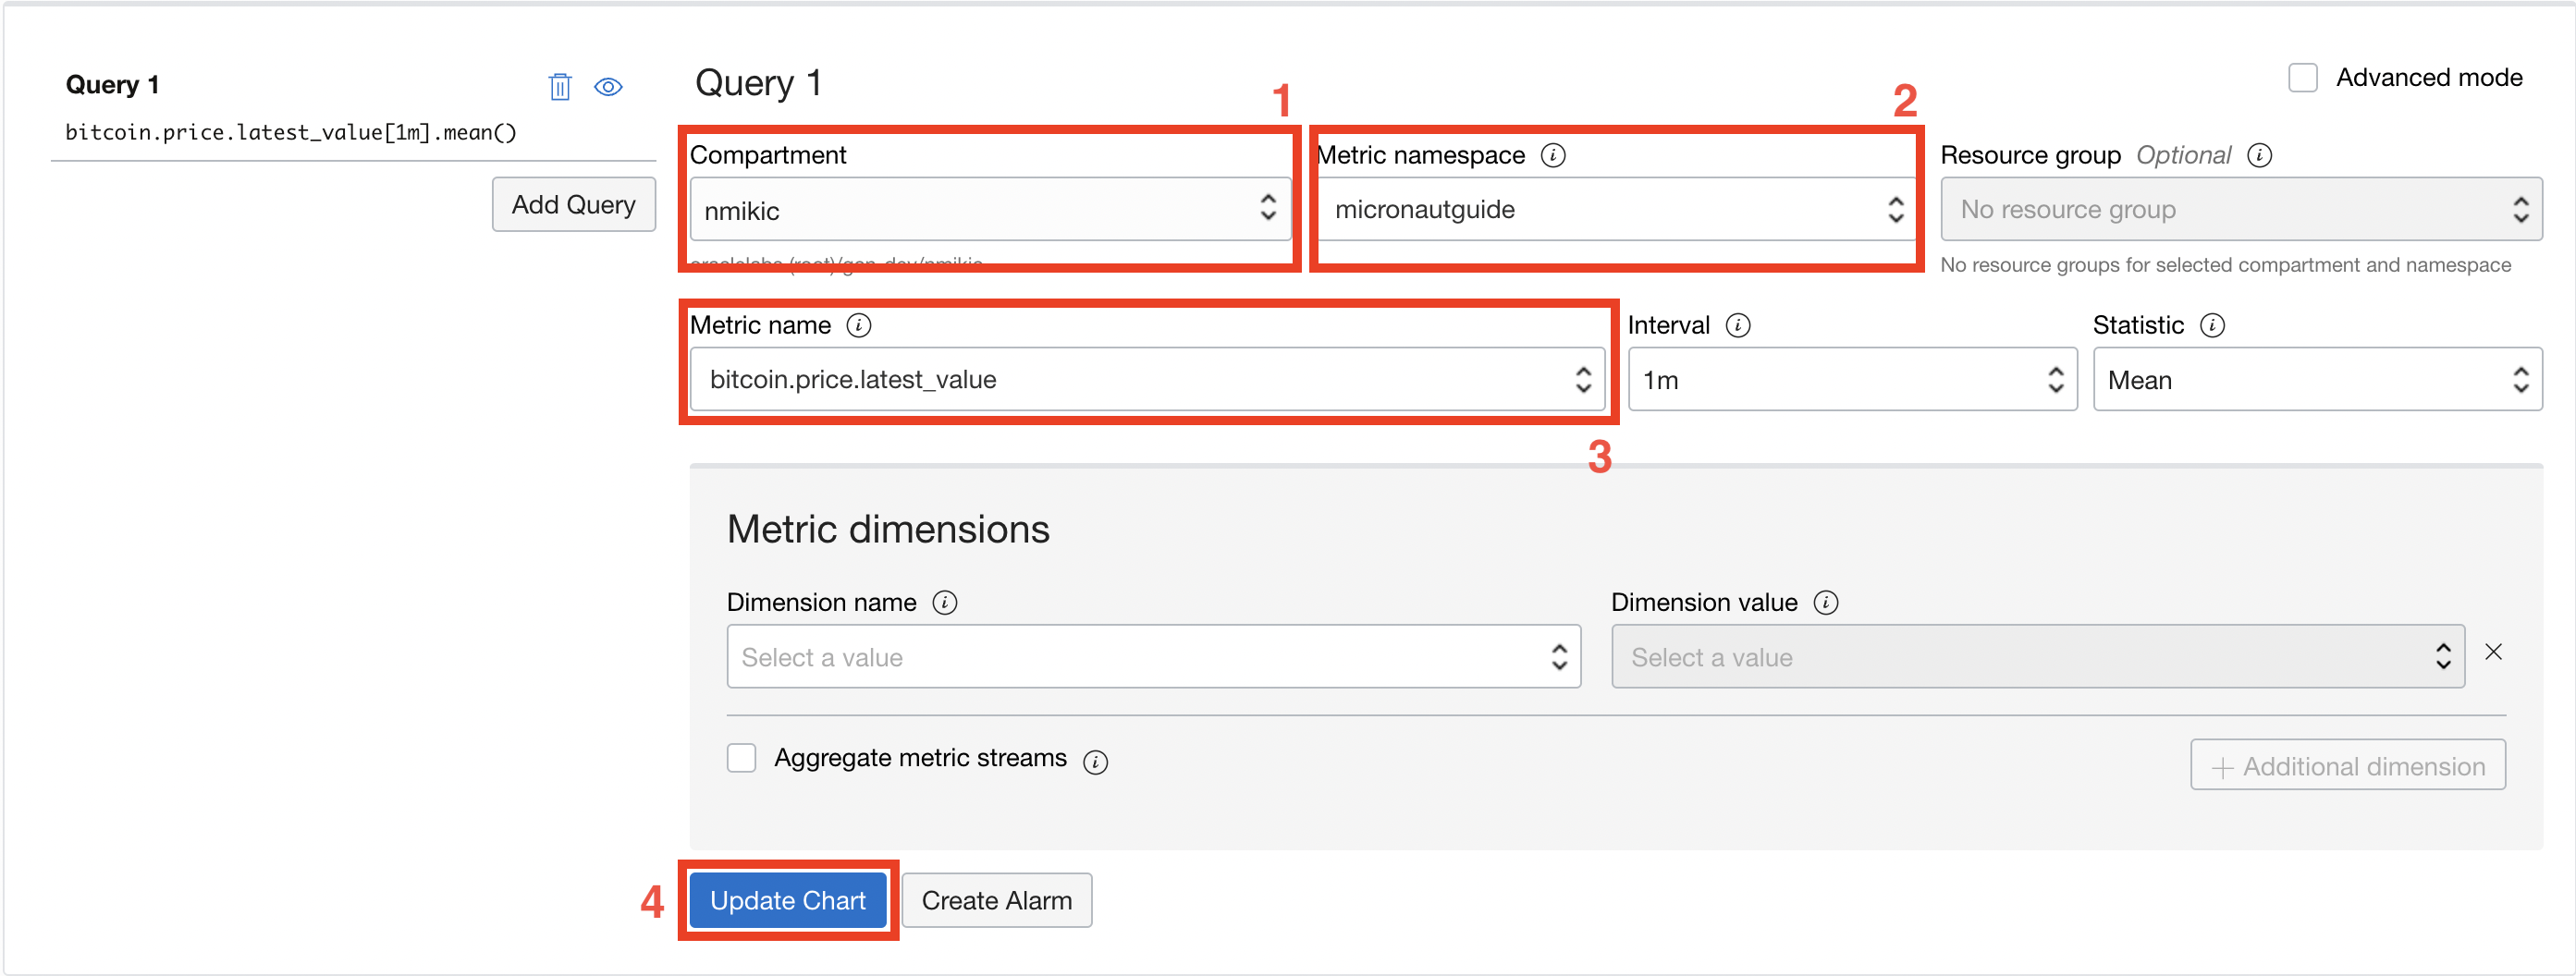
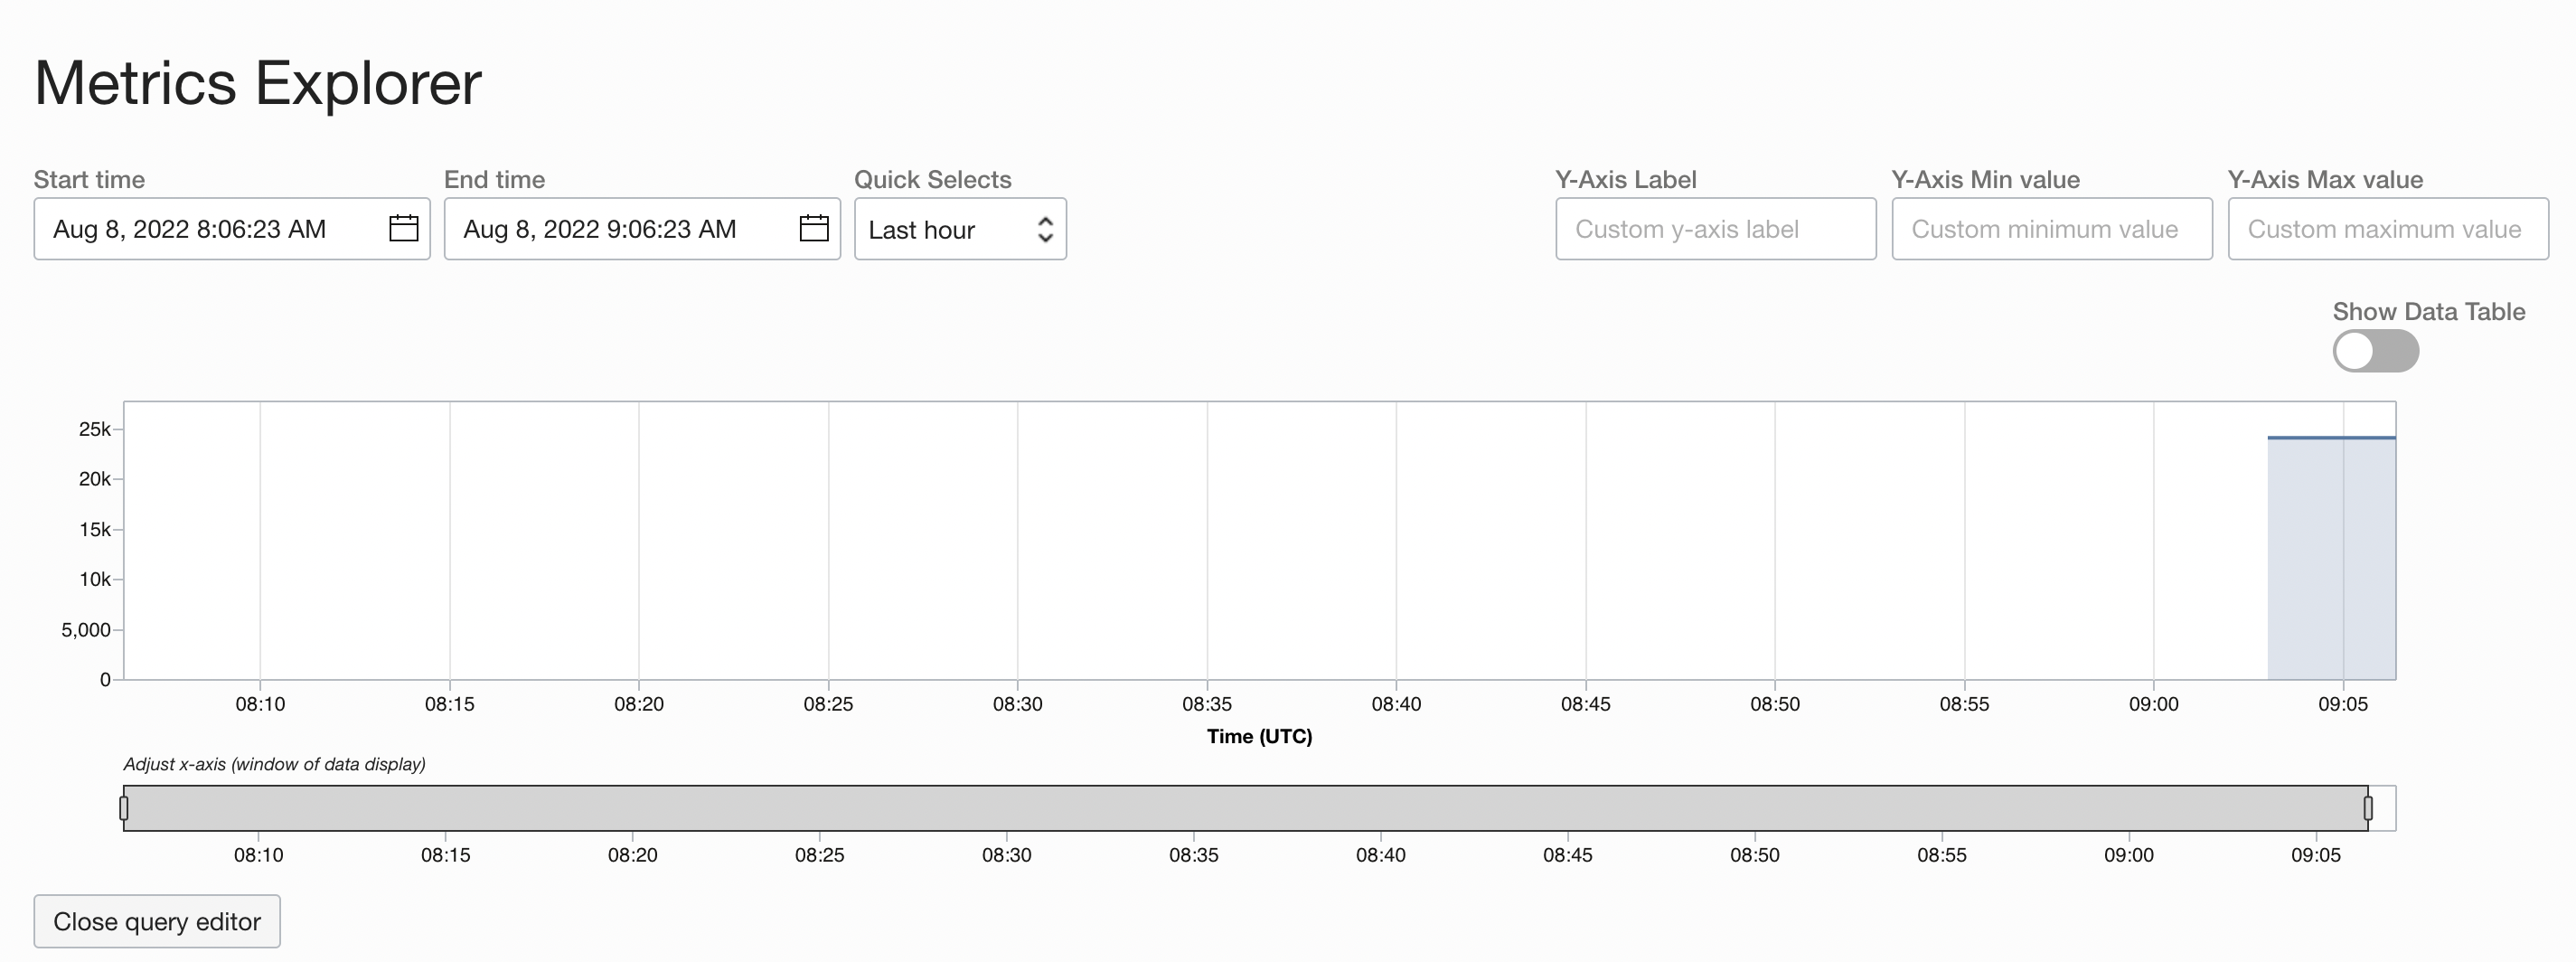
After clicking the (#4) Update Chart button, you will see values of your selected metric in the Metrics Explorer.
Next Steps
Explore more features with Micronaut Guides.
Read more about Micronaut Oracle Cloud integration and how to use advanced monitoring queries on Oracle Cloud Monitoring.
License
|
Note
|
All guides are released with an Apache License 2.0 for the code and a Creative Commons Attribution 4.0 license for the writing and media (images). |