Table of Contents
- 1. Getting Started
- 2. What you will need
- 3. Solution
- 4. Writing the application
- 5. Run AWS OTel Collector locally
- 6. AWS Command Line Interface
- 7. OpenTelemetry dependencies
- 8. Disable OpenTelemetry for tests
- 9. Running the application
- 10. Next Steps
- 11. Help with the Micronaut Framework
- 12. License
Microservices Distributed Tracing with OpenTelemetry through X-Ray and the Micronaut Framework
Use AWS X-Ray distributed tracing to investigate the behavior of your Micronaut applications.
Authors: Sergio del Amo
Micronaut Version: 4.10.9
1. Getting Started
In this guide, we are going to use OpenTelemetry to collect distributed tracing information of a Micronaut application composed of three microservices and publish it to AWS X-Ray
AWS X-Ray helps developers analyze and debug distributed applications, such as those built using a microservices architecture. With X-Ray, you can understand how your application and its underlying services are performing to identify and troubleshoot the root cause of performance issues and errors. X-Ray provides an end-to-end view of requests as they travel through your application and displays a map of your application’s underlying components. You can use X-Ray to analyze both applications in development and in production, from simple three-tier applications to complex microservices applications consisting of thousands of services.
You will discover how the Micronaut framework eases AWS X-Ray integration via OpenTelemetry.
2. What you will need
To complete this guide, you will need the following:
-
Some time on your hands
-
A decent text editor or IDE (e.g. IntelliJ IDEA)
-
JDK 21 or greater installed with
JAVA_HOMEconfigured appropriately
3. Solution
We recommend that you follow the instructions in the next sections and create the application step by step. However, you can go right to the completed example.
-
Download and unzip the source
4. Writing the application
The application contains three microservices.
-
bookcatalogue- Returns a list of books. It uses a domain consisting of a book name and an ISBN. -
bookinventory- Exposes an endpoint to check whether a book has sufficient stock to fulfill an order. It uses a domain consisting of a stock level and an ISBN. -
bookrecommendation- Consumes previous services and exposes an endpoint recommending book names in stock.
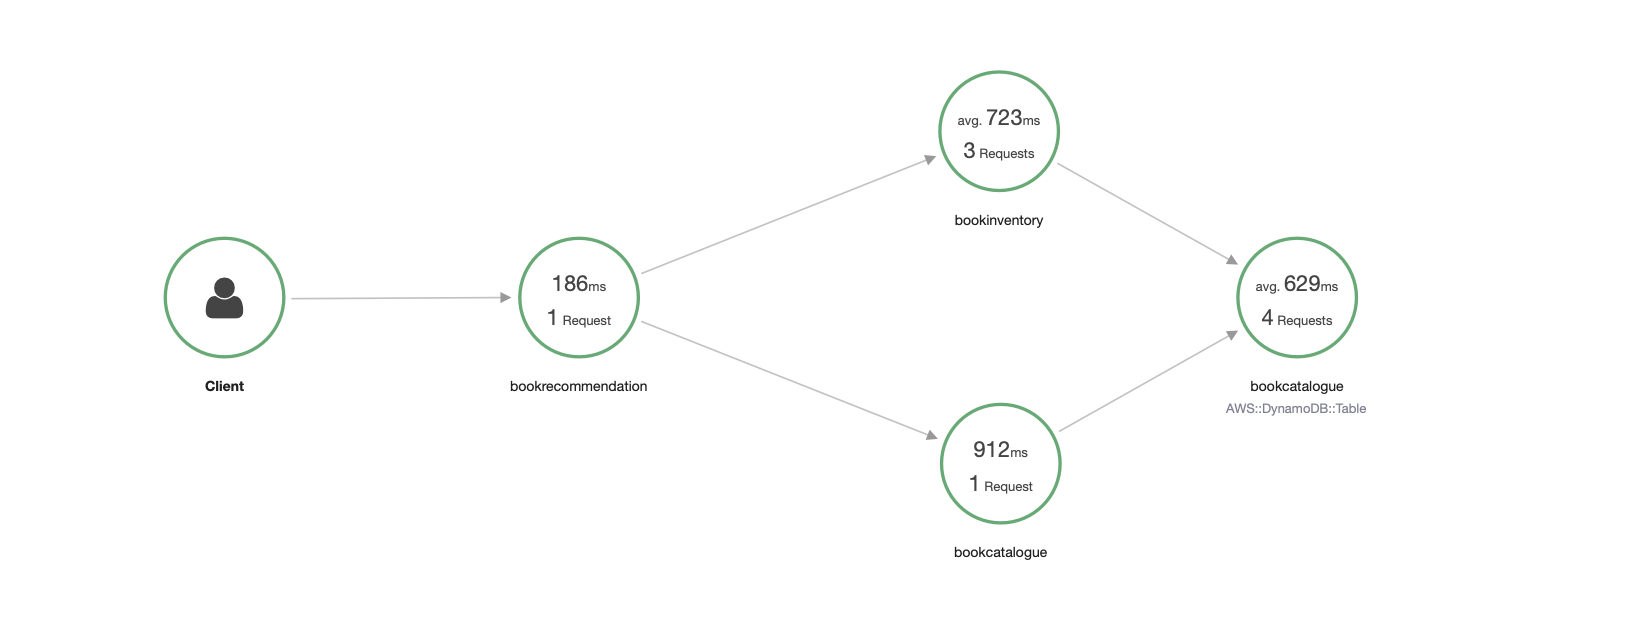
The bookrecommendation service consumes endpoints exposed by the other services. The following image illustrates the application flow:
A request to bookrecommendation (http://localhost:8080/books) triggers several requests through our microservices mesh.
5. Run AWS OTel Collector locally
-
Clone https://github.com/aws-observability/aws-otel-collector
-
vi examples/docker/config-test.yamland set the region -
docker run --rm -p 4317:4317 -p 55680:55680 -p 8889:8888 -e AWS_REGION=us-east-1 -e AWS_PROFILE=default -v ~/.aws:/root/.aws -v "${PWD}/examples/docker/config-test.yaml":/otel-local-config.yaml --name awscollector public.ecr.aws/aws-observability/aws-otel-collector:latest --config otel-local-config.yaml
6. AWS Command Line Interface
Install the AWS Command Line Interface and run aws configure.
Set the same region you used in the previous section.
7. OpenTelemetry dependencies
7.1. Micronaut OpenTelemetry HTTP
To enable creation of span objects on every HTTP server request, client request, server response, and client response, each service includes the next dependency:
<dependency>
    <groupId>io.micronaut.tracing</groupId>
    <artifactId>micronaut-tracing-opentelemetry-http</artifactId>
    <scope>compile</scope>
</dependency>
7.2. OpenTelemetry Protocol Exporter
An exporter is a component in the OpenTelemetry Collector configured to send data to different systems/back-ends.
Each service adds the OpenTelemetry Protocol exporter dependency.
<dependency>
    <groupId>io.opentelemetry</groupId>
    <artifactId>opentelemetry-exporter-otlp</artifactId>
    <scope>compile</scope>
</dependency>
7.3. OpenTelemetry Propagator
To use AWS X-Ray propagator, each service adds the following dependency:
<dependency>
    <groupId>io.opentelemetry.contrib</groupId>
    <artifactId>opentelemetry-aws-xray-propagator</artifactId>
    <scope>compile</scope>
</dependency>
and the following configuration:
otel.traces.exporter=otlp
otel.traces.propagator=tracecontext, baggage, xray
otel.traces.exclusions=/health
The previous configuration excludes health checks from being traced.
7.4. Using AWS resource detector
Each service includes the following dependency:
<dependency>
    <groupId>io.opentelemetry.contrib</groupId>
    <artifactId>opentelemetry-aws-xray</artifactId>
    <scope>compile</scope>
</dependency>
These dependencies allow you to enable AWS resource detectors for enriching traces with AWS infrastructure information.
7.5. Instrumenting the AWS SDK
inventory and catalogue include the following dependencies to instrument the AWS SDK:
<dependency>
    <groupId>io.opentelemetry.instrumentation</groupId>
    <artifactId>opentelemetry-aws-sdk-2.2</artifactId>
    <scope>compile</scope>
</dependency>
Both services use DynamoDB and include the following dependencies:
<dependency>
    <groupId>io.micronaut.aws</groupId>
    <artifactId>micronaut-aws-sdk-v2</artifactId>
    <scope>compile</scope>
</dependency>
<dependency>
    <groupId>software.amazon.awssdk</groupId>
    <artifactId>dynamodb</artifactId>
    <scope>compile</scope>
</dependency>
micronaut-aws-sdk-v2 dependency creates a bean of type SdkClientBuilder. To instrument the AWS SDK,
Micronaut OpenTelemetry registers a tracing interceptor by creating a bean-creation listener for the bean of type SdkClientBuilder.
8. Disable OpenTelemetry for tests
Each service disables OpenTelemetry for the tests classpath:
micronaut.otel.enabled=false9. Running the application
Run bookcatalogue microservice:
To run the application, execute ./mvnw mn:run.
...
14:28:34.034 [main] INFO  io.micronaut.runtime.Micronaut - Startup completed in 499ms. Server Running: http://localhost:8081
Run bookinventory microservice:
To run the application, execute ./mvnw mn:run.
...
14:31:13.104 [main] INFO  io.micronaut.runtime.Micronaut - Startup completed in 506ms. Server Running: http://localhost:8082
Run bookrecommendation microservice:
To run the application, execute ./mvnw mn:run.
...
14:31:57.389 [main] INFO  io.micronaut.runtime.Micronaut - Startup completed in 523ms. Server Running: http://localhost:8080
You can run a cURL command to test the whole application:
$ curl http://localhost:8080/books
[{"name":"Building Microservices"}
You can then navigate to AWS Console and access the X-Ray UI.
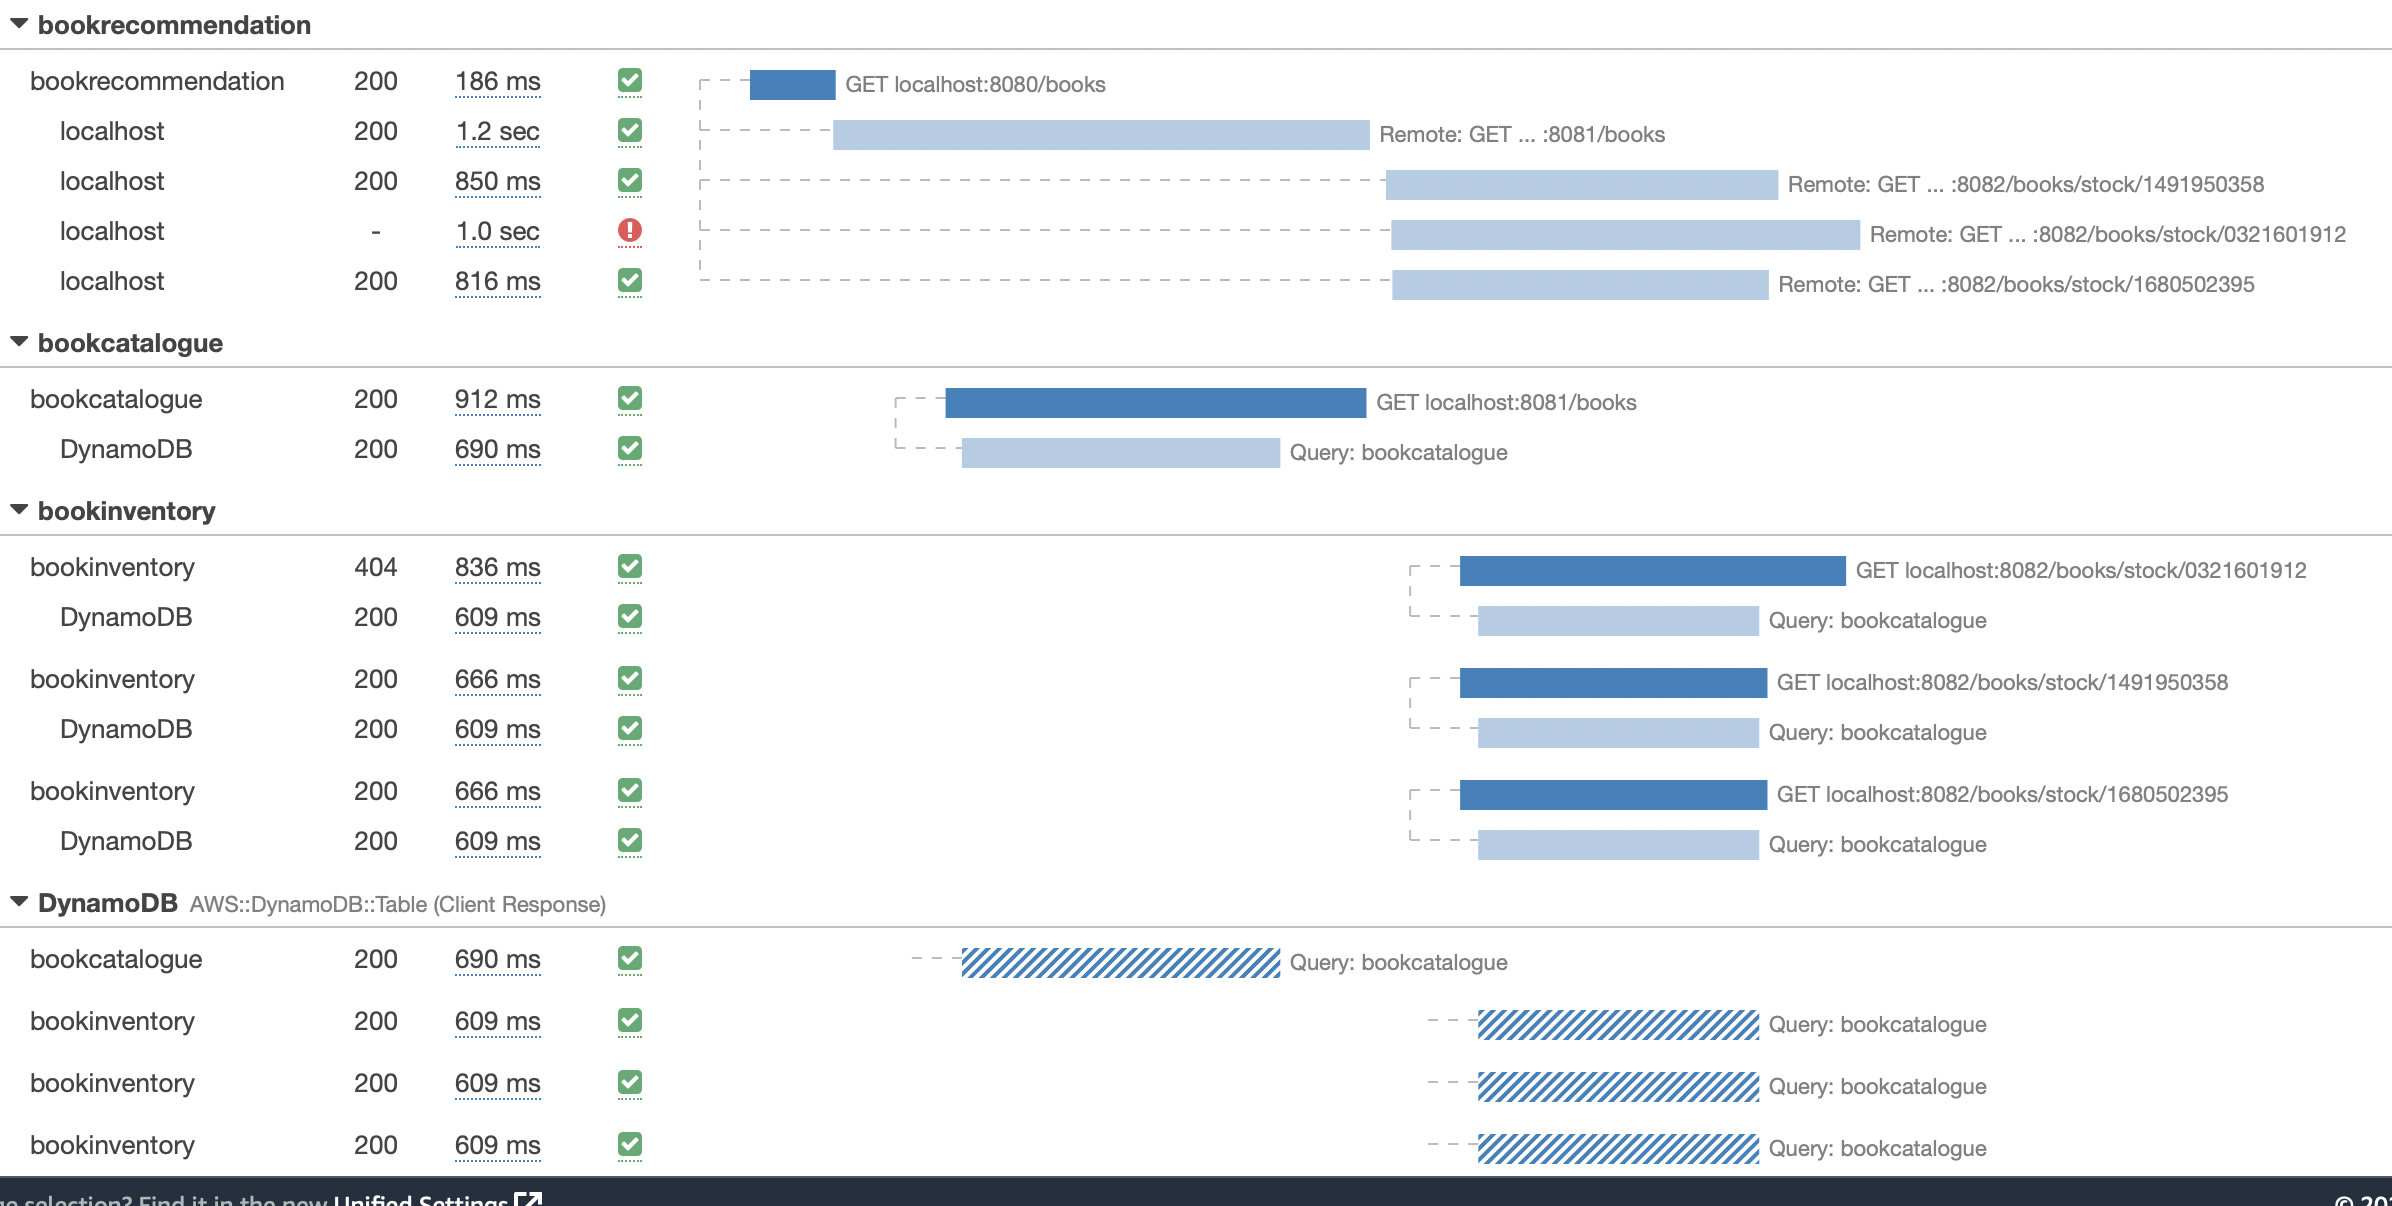
The previous request generates such a trace:


In the previous image, you can see that:
-
Whenever a Micronaut HTTP client executes a new network request, it creates a new subsegment.
-
Whenever a Micronaut server receives a request, it creates a new segment.
Moreover, you can see the requests to bookinventory are made in parallel.
10. Next Steps
As you have seen in this guide, you get distributed tracing up and running fast with the Micronaut framework without any annotations.
The Micronaut framework includes several annotations to give you more flexibility.
Make sure to read the documentation about Micronaut X-Ray integration.
11. Help with the Micronaut Framework
The Micronaut Foundation sponsored the creation of this Guide. A variety of consulting and support services are available.
12. License
| All guides are released with an Apache license 2.0 license for the code and a Creative Commons Attribution 4.0 license for the writing and media (images…). |